AI-powered insights for your ThingsBoard dashboards
Select any ThingsBoard widget — telemetry chart, alarm table, or device map — and get instant AI summaries and anomaly alerts, without touching the ThingsBoard REST API.
Free to start — no credit card needed | First insight in under 30 seconds
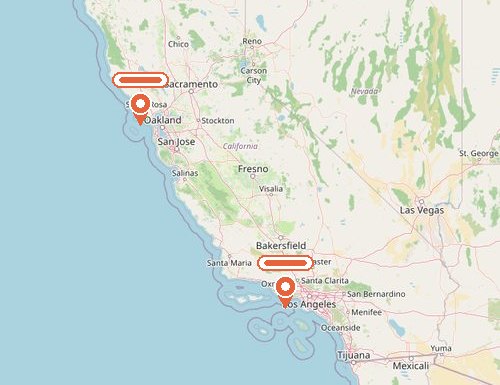
seenzi’s real analysis — run on ThingsBoard’s live demo (environmental monitoring). It is a live demo instance, so the data changes over time.
 AI insight
Unacknowledged temperature alerts
Both sensors (SF Bay + LA) are reporting red status. 5 critical high-temperature alarms in the last 30 days have cleared but stayed unacknowledged — worth a look before the next threshold breach.
ThingsBoard Gives You Data. It Doesn't Tell You What It Means.
The rule engine generates constant telemetry and alarms across every widget, but somebody still has to scan trend charts and alarm logs by eye to work out what is actually wrong — and which of the twelve things currently lit up is the one that matters.
Let seenzi Read Your ThingsBoard Widgets For You
seenzi is an AI assistant for ThingsBoard dashboards that reads any chart, gauge, or alarm table directly from your browser — no querying the ThingsBoard API, no writing rule chains, no granting database access.
Instant widget summaries
Select any widget and get a plain-language read of what the data is actually saying — no more scanning tables and maps trying to spot the story.
Anomaly & alarm context
Select an alarm or event table and seenzi summarizes severity, picks out the pattern, and suggests likely causes alongside the telemetry it sits next to.
A recommended next step
Beyond “what happened”, seenzi suggests where to look next — turning a wall of ThingsBoard sensors, tables, and maps into a short list worth acting on.
From ThingsBoard Widget to AI Insight in 3 Clicks
- 1
Open your ThingsBoard dashboard
Cloud, self-hosted, or on-premise — all the same to seenzi. No API keys, no rule chains, nothing to configure first.
- 2
Select the widget
Drag seenzi's capture tool around the region you care about: a telemetry chart, an alarm table, or a device map.
- 3
Read the insight card
Overview, anomaly, risk, and recommendation — in under 30 seconds. Ask follow-up questions on the same capture, or select several widgets and get a summary that connects them.
Built for ThingsBoard Power Users
A slow temperature drift on a device telemetry widget is the kind of thing that only becomes an alarm once it has crossed a threshold. The drift itself is visible well before that — it just needs something looking at the shape of the line rather than its latest value.
ThingsBoard + seenzi: Common Questions
seenzi is not affiliated with ThingsBoard, and needs no integration with it — the same capture-and-analyze flow works on Grafana and on any other web dashboard you already run.